How we 20x LLM eval throughput


Right now, somewhere deep in Mercor’s infrastructure, a model is being handed a prompt it has never seen before and being asked to complete a unit of work. By the time you finish this post, about three thousand more will have run. We run more than 2.5 million of these workloads a week, four every second, across 241 different models.
Each of these workloads represents one of our eval runs, capturing the step by step reasoning, tool calls, and other useful information that helps us evaluate the overall difficulty of tasks we create as reinforcement learning training data.
These tasks are created on Studio, the annotation platform where Mercor experts author the work that models will be tested and trained against.
If these challenges sound exciting to you, come work with us!
The scale problem
We run large batches of model evals, creating trajectories for tasks and then grading them. A batch fans out thousands of evals; each eval runs a model against a task inside its own container. The model gets a sandboxed environment, whatever tools the work calls for, and executes its work in a loop until completion.
Since the end of last year, we’ve seen our volume of trajectories explode.
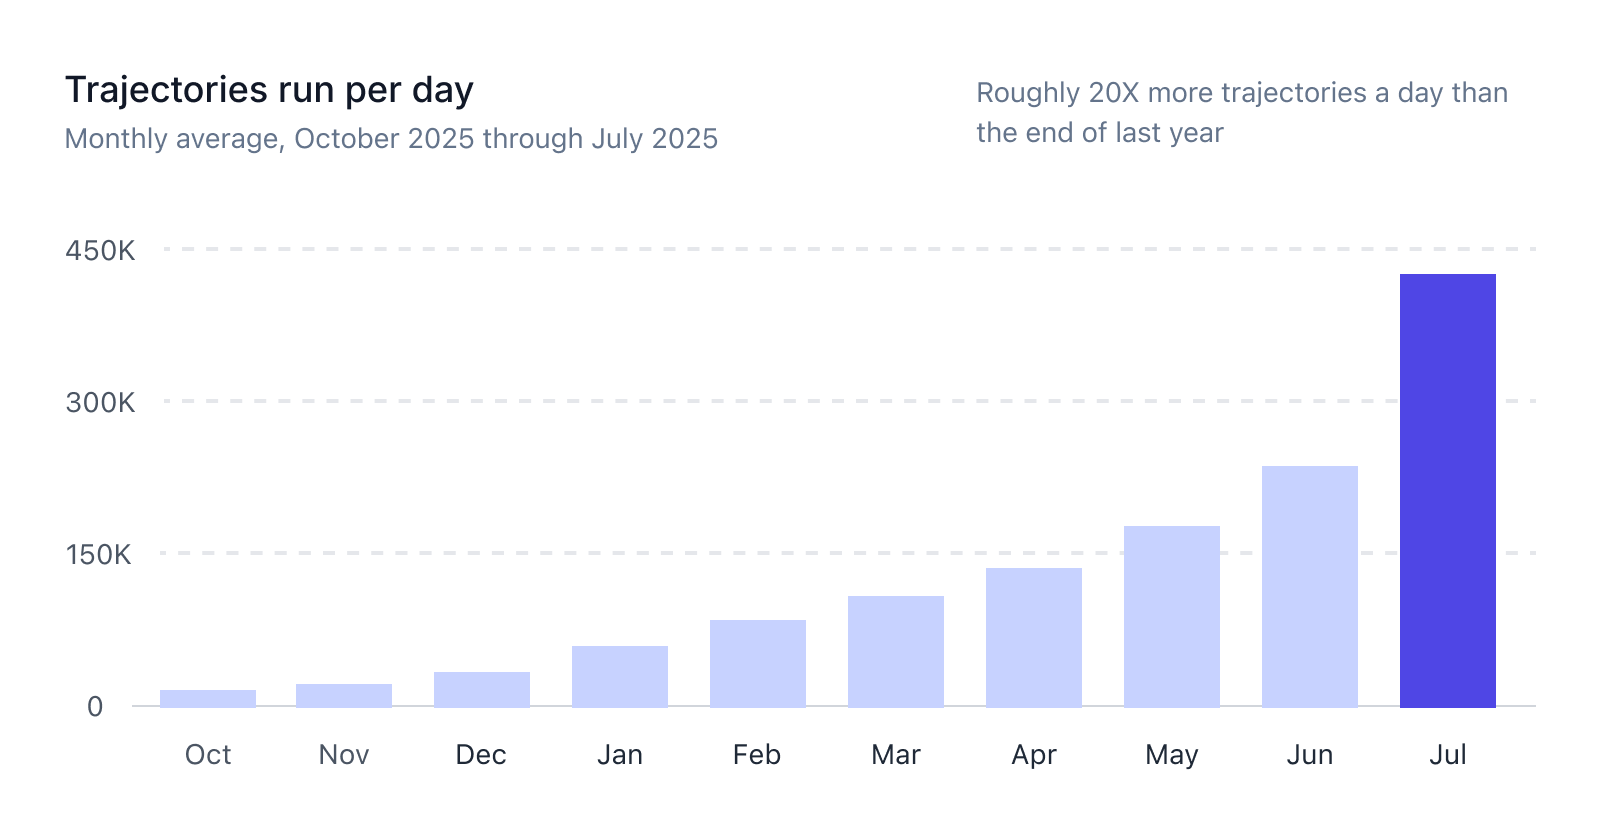
That growth didn't break anything in a way that showed up as a specific class of error. What we saw was a systemic increase in the average end to end duration of eval runtimes. When we dug into where the time was actually going, the answer wasn't what we expected.
The compute wait bottleneck
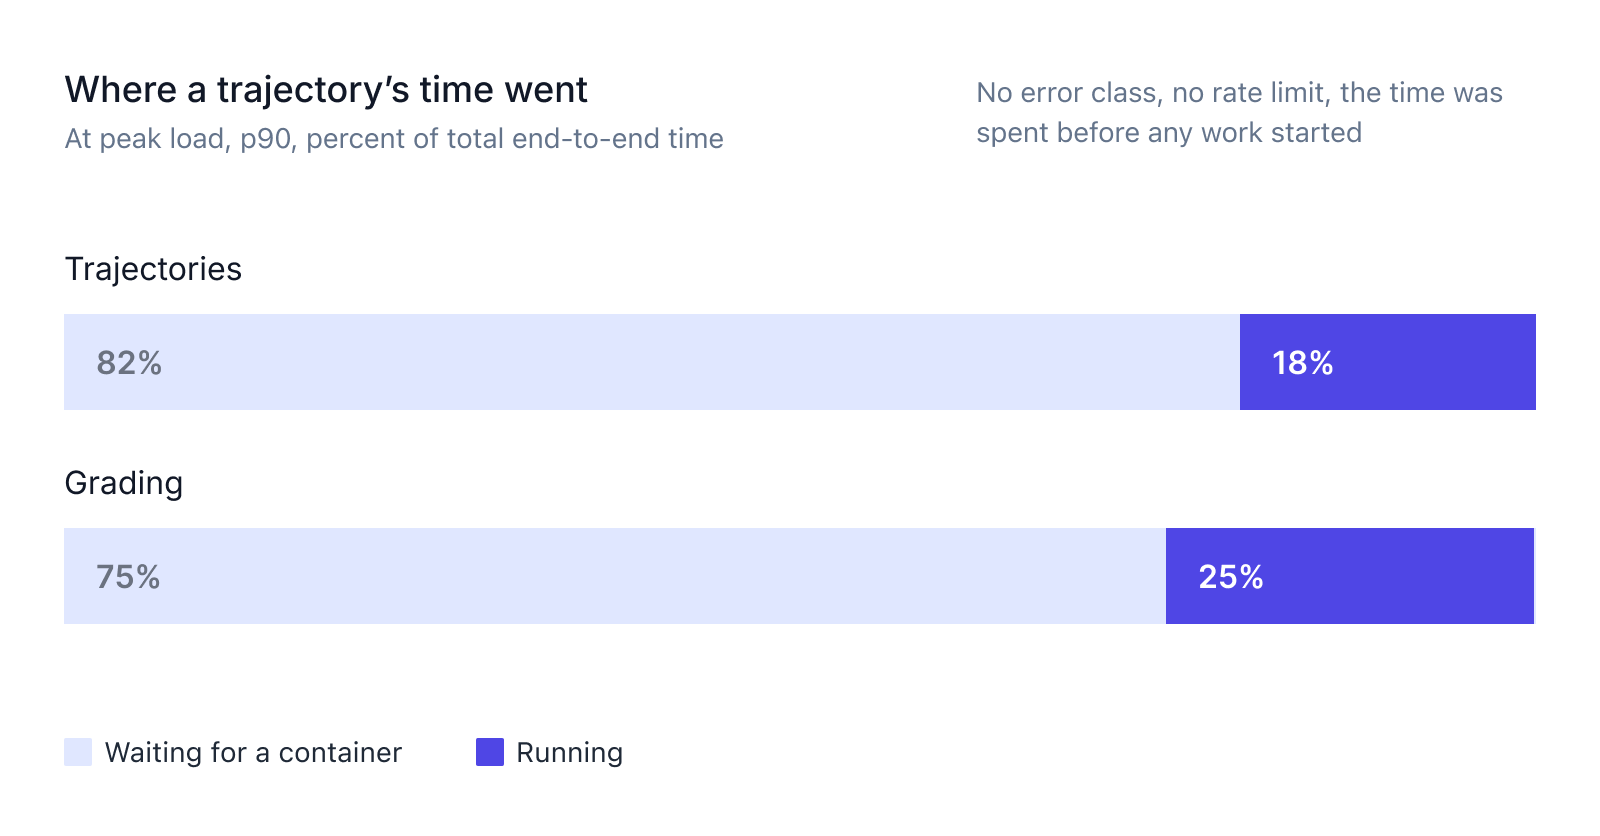
Our p90 trajectories spent 82% of their time waiting for a compute container and 18% running, with the grading stage spending 75% waiting and 25% running.
Our natural initial assumption was that we were hitting rate limits at our model providers. As we dug into the underlying metrics and logs though, we uncovered two bottlenecks that we needed to evolve our architecture around to support the next level of scale for Mercor.
Global capacity partitioning
We started to see hot spots in particular models that dominated traffic on the system as our volume of evals and number of supported models grew. Large batches blocked other workloads that ran smaller, more frequent bursts, or that ran against lower trafficked models. We incrementally partitioned these high-usage models onto isolated queuing lanes by dedicating capacity out from a global maximum limit. As overall usage grew, we had to create more dedicated lanes, each of which diminished the overall ceiling of any individual lane. We needed to evolve our architecture to use our maximum compute capacity against any one model when traffic was concentrated, but distribute fairly across many when needed.
Provider capacity underutilization
As our volume of activity increased against our most popular models, we started reaching the limits of capacity that our providers could give us. Now we had to plan for how high we would let our concurrency grow when getting spikes of evals from very large or numerous batches against a single model. Historically these were managed with hard pins, but when truly pushing the limits of maximally utilizing our ceiling, this was prone to noisy neighbor problems or being slightly over/under provisioned. We needed to improve the sophistication of our scaling and backoff to reach maximum utilization of the capacity we had available while being able to dynamically adjust based on measured signals.
To address both of these and evolve our architecture to support the next level of scale for Mercor, we designed a dynamic compute scheduler to prioritize and execute workloads across diverse usage patterns and dynamic capacity availability.
The Studio Compute Scheduler
Before
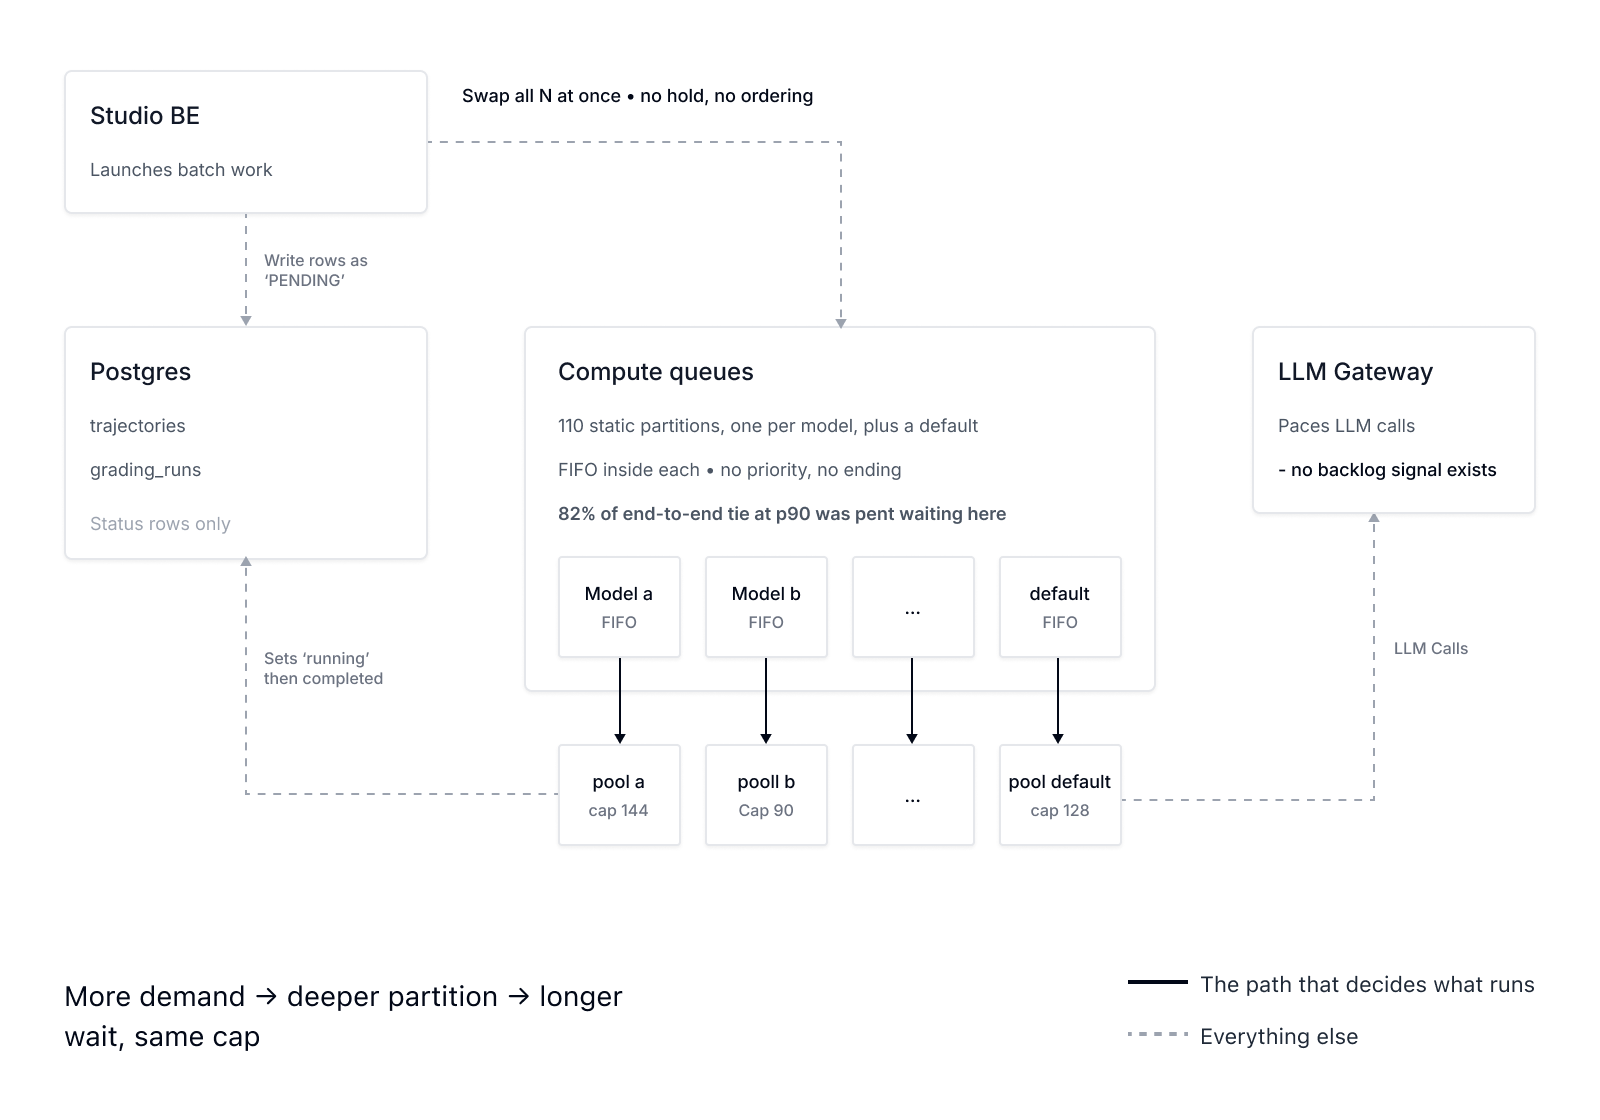
The Studio eval queueing system before the compute scheduler redesign
After
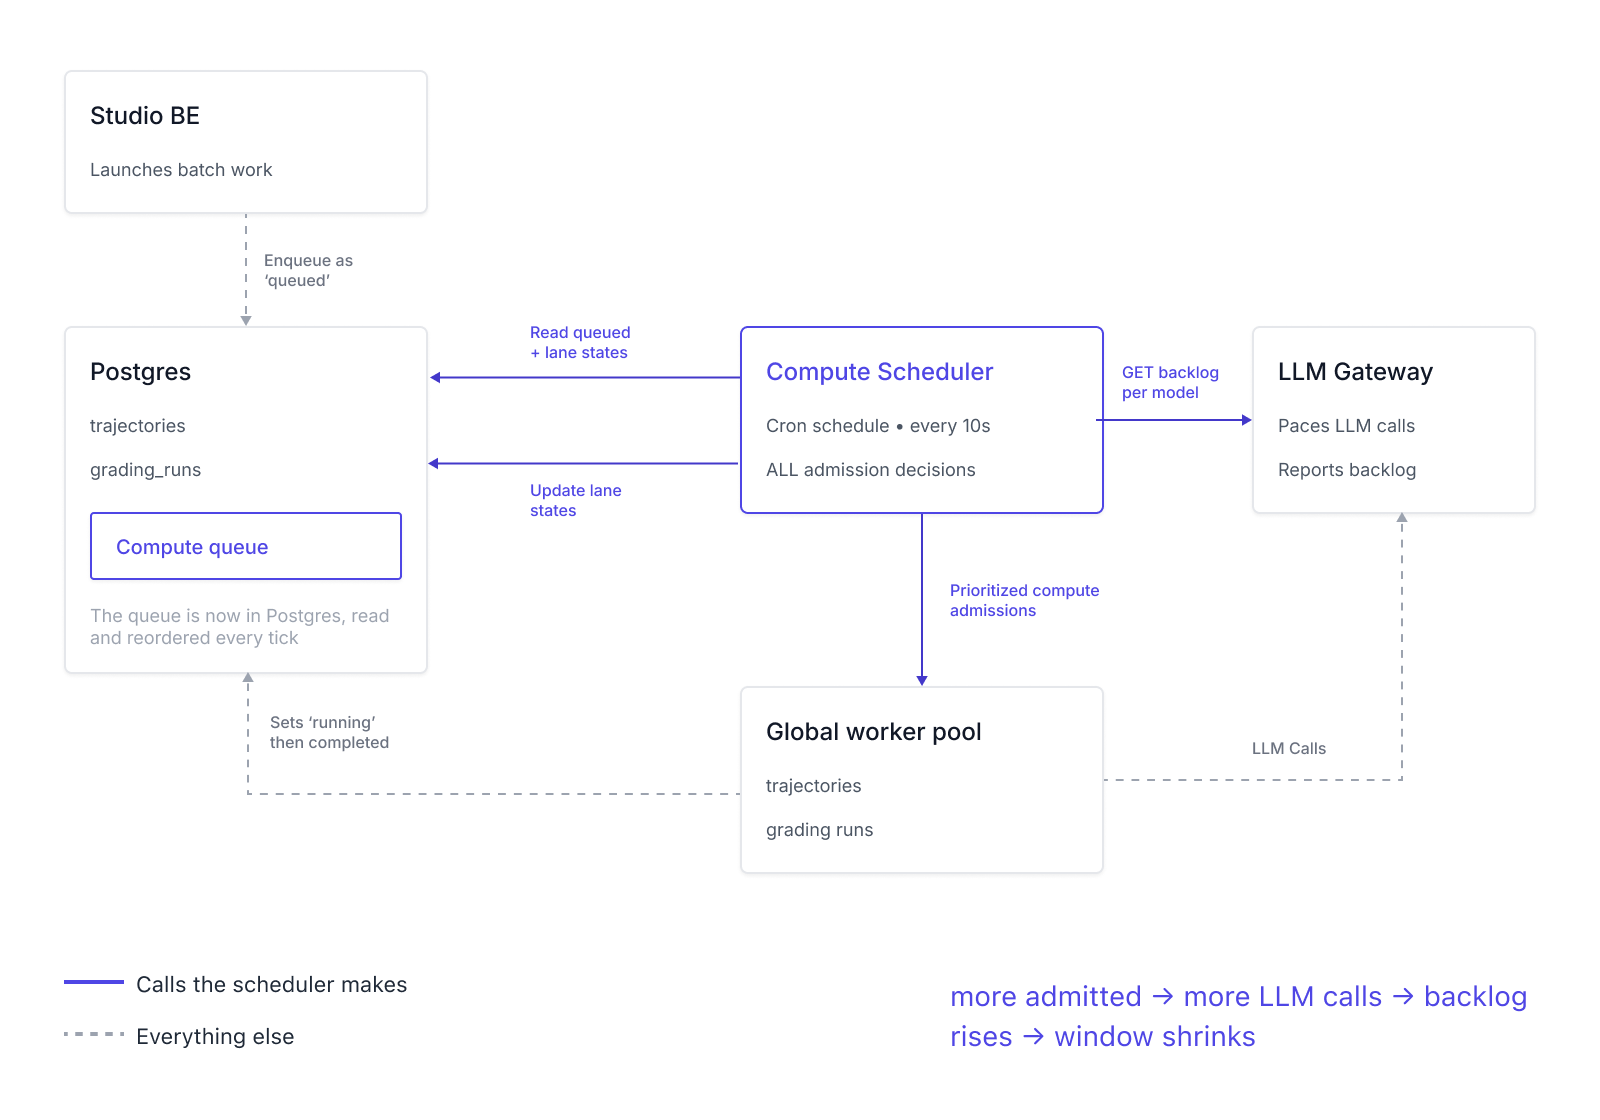
The new Studio eval compute scheduler
Overview
We already run an LLM gateway in front of the providers, with a queue per model so we don't overload them: when a provider is backed up, its LLM calls wait at the gateway. That protects the provider, but not our own cost. An LLM call only reaches the gateway once its job is already running, and the job holds a container for the whole time it waits there. The gateway can delay an LLM call; it can't evict a running job, or decide it shouldn't have started.
So the queue we were missing was one level up, at the job rather than the LLM call. Jobs in a batch no longer all start at once. They wait before they have a container, which costs nothing, and a scheduler pass every ten seconds decides which ones go.
Each pass makes two decisions: how many jobs each model should be running, and which of the waiting jobs get those slots.
Concurrency
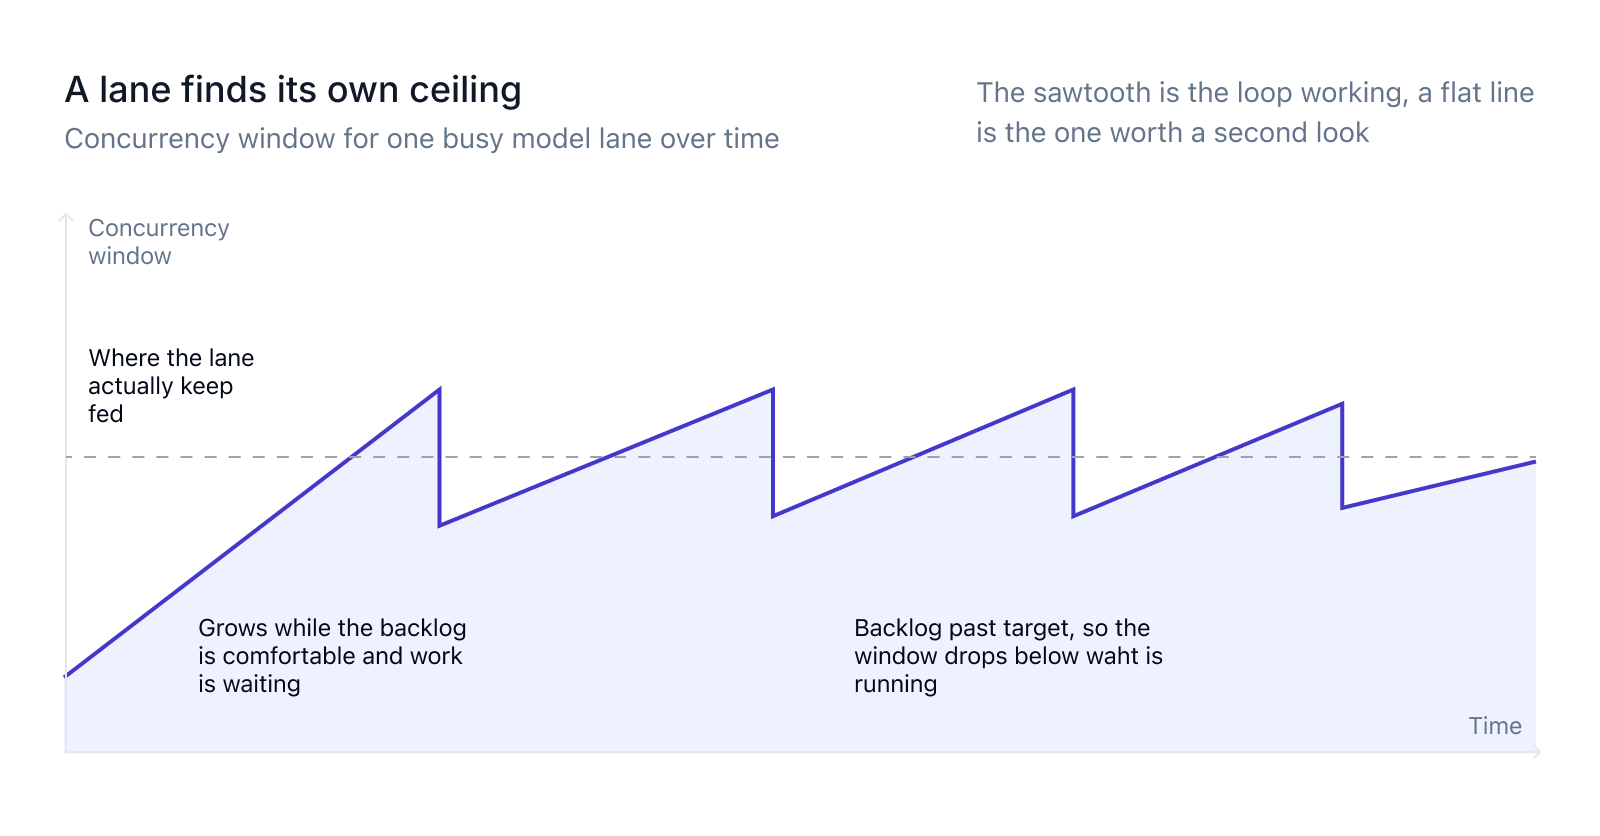
The scheduler caps how many jobs run against each model at once. The gateway has its own limit, but that one is over LLM calls rather than jobs, and how it spends a provider's capacity is a black box from here. One number crosses between the two: how deep a model's queue at the gateway is.
That's all the scheduler needs, because it only has one question to settle: would starting more jobs actually get more work done? An empty or shallow gateway queue means the running jobs aren't producing LLM calls fast enough to keep the provider busy, so the answer is yes. A gateway queue that keeps growing means they already want more than the provider will give, and more jobs would only make it longer. Nothing tells you which case you're in ahead of time, since a job might make one LLM call or fan out into dozens, and switch halfway through.
So the job limit follows the gateway queue: up a step while it's below target and work is waiting, down when it runs past, steady in between. Within a few minutes it settles on the number that keeps a model busy without backing it up, which is the number we used to set by hand.
Admission Control
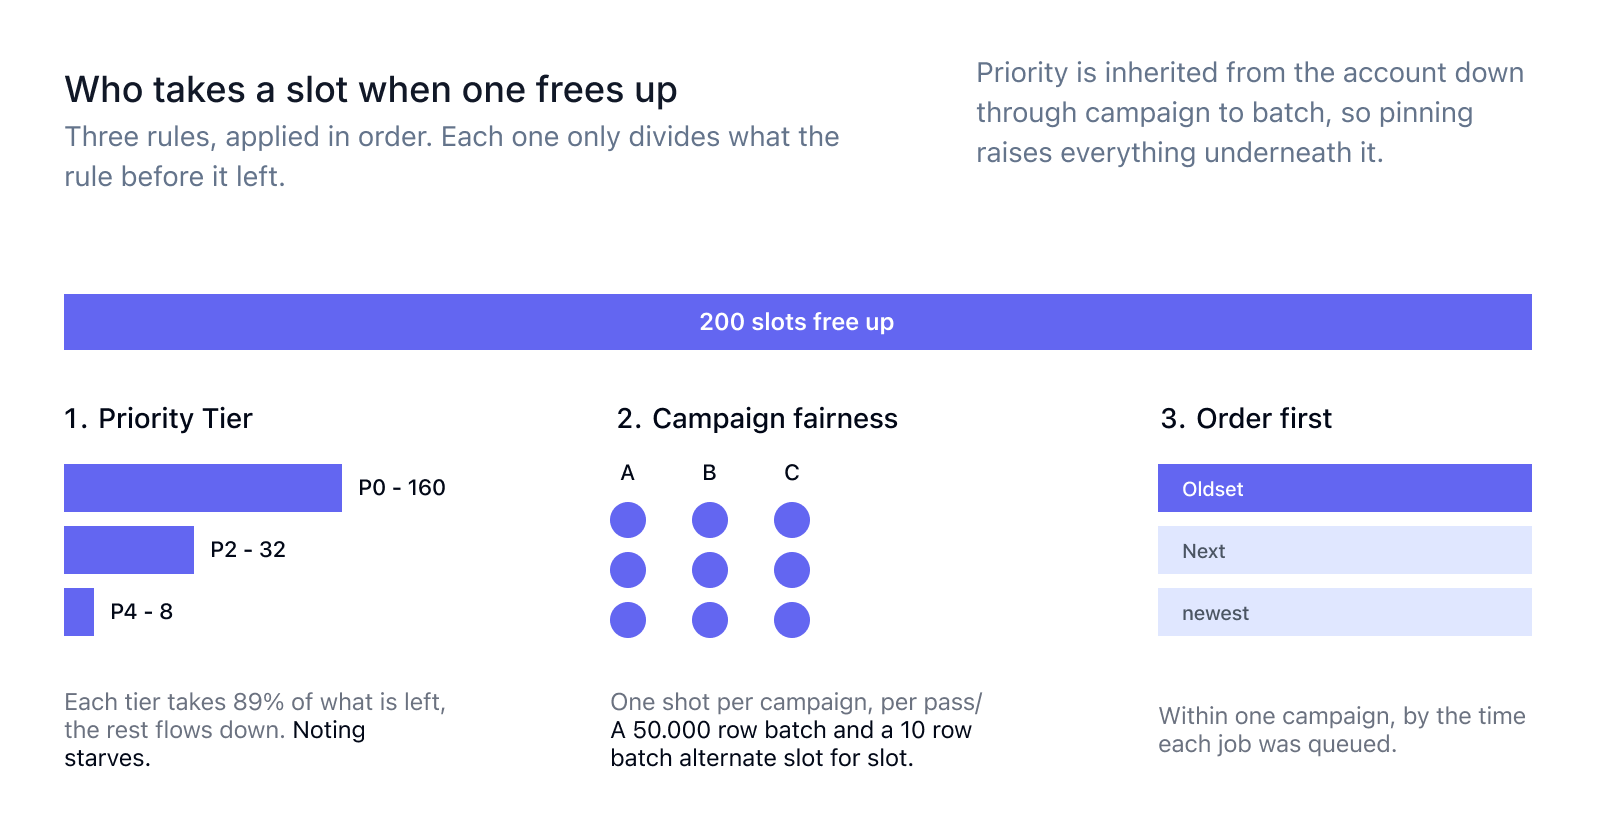
The limit says how many jobs a model can start this pass; something still has to decide which ones. The old answer was whoever asked first, which is how a 20-job customer delivery ended up behind all 5,000 jobs of an eval batch that launched five minutes earlier.
Three rules divide them up now, each splitting only what the rule above it didn't use. Priority tiers come first, but weighted rather than absolute: a tier takes 80% of whatever is left to it, so lower-priority work keeps draining slowly instead of stopping dead whenever something urgent shows up. Within a tier, projects take turns one job at a time, so a 50,000-job batch and a 10-job batch move at the same rate and volume alone doesn't buy priority. Within a project, oldest first. Priority is inherited from the account down through the project to the batch, so pinning one account lifts everything under it, which in practice is the control we reach for most.
What We Saw
| Model | Increase |
|---|---|
| GPT-5.5 | 20x |
| Claude Opus 4.8 | 12x |
| Claude Opus 4.7 | 12x |
| Claude Opus 5 | 9x |
| Claude Sonnet 4.6 | 9x |
| Claude Sonnet 5 | 6x |
After the scheduler took over, our 6 busiest lanes individually saw throughput increases between 6x and 20x above their old caps. None of that came from new provider capacity. It was all quota we already had.
Where we go from here
Today the scheduler adapts off a single signal, backlog depth at the gateway, and the per model limits it reads against are still set by hand in the gateway config. Getting the gateway to adjust those itself would let both layers react to a provider slowing down without anyone editing a file.
The other direction is coverage - there are other LLM heavy workloads across Mercor that never touch the scheduler at all. Over time we want this to be the default path for any job that spends most of its life waiting on a model.
Come work with us
If finding the real ceiling in a system trying to set new upper bounds on running evals and improving LLMs at scale sounds like your kind of problem, come join us to help build the future of Studio and Mercor.